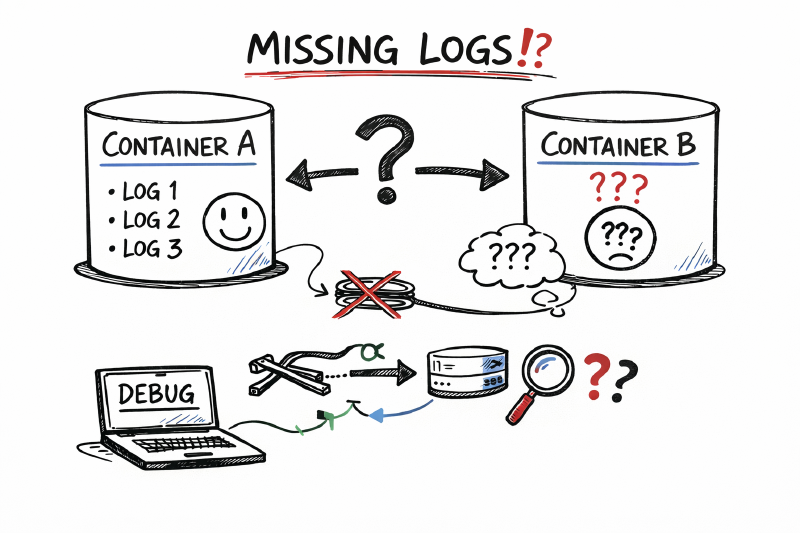
We moved an API from Azure Functions to Azure Container Apps and expected logging to “just work.” Instead, AppTraces stayed empty while ContainerAppConsoleLogs_CL filled up. This is the story of how a custom logger quietly bypassed Application Insights, how we proved the platform still worked, and what we changed to fix it.
Note: I’ve intentionally omitted/substituted any subscription IDs, resource names, and internal identifiers. Code snippets are illustrative.
TL;DR
- If your app only writes to stdout/stderr, Azure Container Apps will show logs in
ContainerAppConsoleLogs_CL, but Application Insights won’t magically populateAppTraces. - Our custom logging abstraction was writing directly to stdout/stderr in Container Apps, bypassing the
ILogger→ Application Insights pipeline. - Fix: route logs through
ILoggerand/orTelemetryClient, ensure the telemetry channel can persist in the container, and flush on shutdown.
The Setup: Functions vs Container Apps
In the old world, the API ran as Azure Functions:
- Application Insights was wired through the standard Functions host.
- Our custom logging abstraction sat on top of the platform logger, and everything showed up in
AppTracesas expected.
When we lifted the same workload into Azure Container Apps, we assumed:
- Reusing the same logging abstraction would be fine.
- Adding the Application Insights SDK “like the docs say” would be enough: connection string in configuration,
AddApplicationInsightsTelemetry, and some health-check logging around startup.
On paper, everything looked correct. In practice, AppTraces stayed completely silent.
What We Tried (Before Finding the Real Issue)
Once we noticed that traces were missing from AppTraces, we did the usual checklist:
- Environment parity: Confirmed the Application Insights resource and Log Analytics workspace were the same ones we used in Functions.
- Configuration: Double-checked the connection string, instrumentation key, and diagnostic settings.
- SDK wiring: Added the Application Insights ASP.NET Core SDK into the container app:
AddApplicationInsightsTelemetryinProgram.cs.- Ensured the connection string came from environment variables, not hard-coded config.
- Registered the Application Insights logging provider.
- KQL sanity checks: Queried both
AppTracesandContainerAppConsoleLogs_CLby timestamp and correlation IDs, just in case this was a query bug.
The result:
- Logs happily appeared in
ContainerAppConsoleLogs_CL. AppTraceskept pretending we didn’t exist.
At this point, we had followed the documentation, the SDK was loaded, but Application Insights still wasn’t seeing our application logs.
The Support Detour
We raised a support ticket, assuming there might be a known limitation or a misconfiguration on the platform side.
The response boiled down to:
- Container Apps write console output into
ContainerAppConsoleLogs_CL. - The
AppTracestable is driven by the Application Insights ingestion pipeline. - You can’t “redirect” console logs into
AppTraces; the suggested approach was to query both tables in a single KQL query.
In other words: “This is a product limitation, you can’t get what you want.”
The problem was that this answer didn’t line up with:
- The official docs that show Container Apps + Application Insights working end-to-end.
- Our own experience with Functions where the same code happily wrote to
AppTraces.
So instead of accepting “not supported” as the final word, we treated it as a clue: if console logs were going only to ContainerAppConsoleLogs_CL, maybe our custom logger was never actually talking to Application Insights at all.
Why This Really Mattered
Telling ourselves “we’ll just query two tables” would have been the easy answer, but it would have hurt us everywhere else:
- Shared KQL patterns: We already had a lot of KQL built around
AppTracesfor other workloads. Copy-pasting those queries and bolting on extra unions for a single service would make them longer and harder to reason about. - Alerts: Many of our alerts were driven by fairly complex queries over
AppTraces. Doubling every query to union inContainerAppConsoleLogs_CLwould make them even more convoluted and fragile. - Dashboards and metrics: Existing dashboards were all wired to
AppTracesas the central source of truth. Splitting one service’s logs across tables would mean either:- Special-casing that service everywhere, or
- Rewriting dashboards to union across tables for all services, even those that didn’t need it.
We wanted:
- A single, consistent telemetry story: “if it’s an application trace, it lives in
AppTraces.” - To avoid polluting every query and alert with table-awareness for one misbehaving service.
In short, fixing the pipeline at the source was far cheaper than living with permanently more complex KQL.
What Actually Went Wrong
The real issue turned out to be our own abstraction, not the platform.
We got there in two parallel ways:
- A developer was manually tracing the flow of a request, checking where logging calls originated and which services were registered in dependency injection.
- In parallel, we asked an AI coding assistant to analyse the codebase and the problem description. With the broader context of “
AppTracesis empty but console logs exist,” it quickly flagged one suspicious area: a custom logging service that wrote directly to stdout/stderr.
Looking more closely at that code, the pattern became obvious:
- We had a custom logging service that wrapped the platform logger.
- In the Functions world, this wrapper ultimately still called
ILogger, which the host wired to Application Insights. - In Container Apps, we reused the same abstraction but changed the implementation to write directly to stdout/stderr.
That subtle change meant:
- Logs still “worked” in the sense that they appeared in
ContainerAppConsoleLogs_CL. - But they completely bypassed the
ILogger→ Application Insights pipeline. - So even though the SDK was installed and configured correctly, Application Insights never saw our logs, and
AppTracesremained empty.
Once we viewed the system as “two independent pipelines” it made sense:
- Console pipeline: stdout/stderr →
ContainerAppConsoleLogs_CL. - App Insights pipeline:
ILogger/TelemetryClient→AppTraces(and other AI tables).
Our custom logger had effectively unplugged itself from the second pipeline, and the coding agent helped us see that faster than we probably would have on our own.
The Fix
We kept the custom logging abstraction but made it Application Insights–aware and ensured the SDK could persist telemetry inside a Linux container.
-
Send scopes to
ILoggerandTelemetryClient- Build a scoped property bag once, use
logger.BeginScope(properties)for structured logs, and also push the same properties intoTelemetryClient.Context.GlobalPropertiesfor telemetry correlation. - Keep disposal safe: restore previous global properties and remove any extras you added.
1
2
3
4
5
6
7
8
9
public IDisposable BeginLogScope(ILogger logger, TelemetryClient telemetryClient) { var properties = BuildLogProperties(); var loggerScope = logger.BeginScope(properties); var telemetryScope = new TelemetryScope(telemetryClient, properties); return new CompositeDisposable(loggerScope, telemetryScope); } - Build a scoped property bag once, use
-
Wire Application Insights explicitly in
Program.cs- Give the telemetry channel a writable folder (the default path isn’t writable in many container images).
- Disable adaptive sampling if you need deterministic logging while debugging.
- Register flush on shutdown so buffered telemetry reaches
AppTracesbefore the container stops.
 1
 2
 3
 4
 5
 6
 7
 8
 9
10
11
12
13
14
15
16
17
18
19
var cachePath = Path.Combine(Path.GetTempPath(), "appinsights-cache"); Directory.CreateDirectory(cachePath); services.AddSingleton<ITelemetryChannel>(_ => new ServerTelemetryChannel { StorageFolder = cachePath }); services.AddApplicationInsightsTelemetry(opts => { opts.ConnectionString = Environment.GetEnvironmentVariable("APPLICATIONINSIGHTS_CONNECTION_STRING"); opts.EnableAdaptiveSampling = false; opts.EnableDependencyTrackingTelemetryModule = true; }); services.AddLogging(b => b.AddApplicationInsights()); app.Lifetime.ApplicationStopping.Register(() => { telemetryClient.Flush(); telemetryChannel?.Flush(); Thread.Sleep(TimeSpan.FromSeconds(5)); }); -
Turn on SDK diagnostics while debugging
- Setting
APPLICATIONINSIGHTS_DIAGNOSTICS_LOG_LEVEL=Verbosemade it obvious that nothing was reaching the ingestion pipeline until theTelemetryClienthookup was added.
- Setting
Bonus: Improvements We Would Have Missed
The coding agent didn’t just find the custom logger problem; it also highlighted a few things we hadn’t fully appreciated:
- Telemetry channel storage in Linux containers: The default
ServerTelemetryChanneluses on-disk storage. In many Linux container images, the default path isn’t writable, so the channel quietly disables persistence. Explicitly providing a writableStorageFolderkeeps buffering working instead of silently failing. - Flushing on shutdown: Without a call to
telemetryClient.Flush()(and a brief wait) in anApplicationStoppinghandler, short-lived containers can exit before telemetry is sent. Adding an explicit flush ensures traces actually leave the container. - Dependency tracking for correlation: Disabling modules like
DependencyTrackingTelemetryModulestops HTTP client spans from reaching Application Insights. That means you lose end-to-end correlation between requests, dependencies, and traces inAppTraces/AppRequests. Re-enabling dependency tracking restored that visibility.
Those suggestions improved more than just this one service—they were a useful checklist for other containerised workloads using Application Insights.
Proof It Worked
Once the custom logger was integrated with both ILogger and TelemetryClient, things changed immediately:
- The same log messages appeared in both
ContainerAppConsoleLogs_CLandAppTraces. - KQL queries like
AppTraces | where Message contains "<sample text>"started returning results. - End-to-end correlation across HTTP requests, dependencies, and custom traces started behaving the way the docs promised.
At that point, we had a clear picture:
- The platform did support Application Insights in Container Apps.
- Our own custom logger had been bypassing the pipeline the whole time.
Takeaways for Container Apps + App Insights
- Console output alone won’t light up
AppTraces; you need the Application Insights logger provider orTelemetryClientin the path. - Custom logging abstractions should decorate, not replace, the platform logger. If your abstraction writes straight to stdout/stderr, Application Insights will never see it.
- In containers, configure a writable telemetry channel and flush on shutdown so you don’t lose buffered telemetry when the container stops.
- When support says “not supported,” it might mean “not supported the way you’re currently doing it.” A minimal repro with the SDK and a very simple logger is often the fastest way to prove (or disprove) that.
If you’re migrating from Functions to Container Apps and AppTraces is silent, start by looking for any custom logger that skips ILogger/TelemetryClient. Plug it into the App Insights pipeline, give the channel somewhere to write, flush on exit, and your traces should come back to life.